-
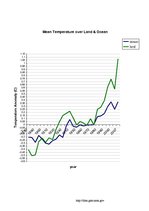
Describing the Graph of Mean Temperature Changes for Land and Ocean
Szint:
Középiskola
Irodalom:
–
Referenciák:
Nincs használatban
Küldés e-mailben
Az Ön neve:
Adja meg az e-mail-címet, amelyen meg szeretné kapni a linket:
Üdv!
{Your name} szerint érdemes lehet megtekinteni ezt a dokumentumot az eKönyvtárban „Describing the Graph of Mean Temperature Changes for Land and Ocean”.
A dokumentumra mutató link:
https://www.ekonyvtar.eu/w/295950
A dokumentumra mutató link:
https://www.ekonyvtar.eu/w/295950
E-mail elküldve